📚 Unlock the World of AI and Humanity with These Two Free Books! 🚀
Dive into the thrilling realms of artificial intelligence and humanity with "The ECHO Conundrum" and "Awakening: Machines Dream of Being Human". These thought-provoking novels are FREE this week! Don't miss the chance to explore stories that challenge the boundaries of technology and what it means to be human.
Read More & Download
The substitution effect is a fundamental concept in microeconomics that describes how changes in the relative prices of goods influence consumer behavior. This article will explore the substitution effect, providing clear examples and graphical illustrations to solidify your understanding.
 Substitution Effect – Woman trying to decide what item to buy in a groceryAlt: A woman in a grocery store contemplates different products, illustrating the consumer choices influenced by the substitution effect.
What is the Substitution Effect?
The substitution effect explains the shift in demand for a product due to changes in its price relative to substitute goods. When a product’s price increases, it becomes comparatively more expensive than its alternatives. Consequently, consumers tend to switch from the pricier item to its substitutes. Conversely, a price decrease makes a product more attractive, potentially drawing consumers away from substitutes.
A Practical Example of the Substitution Effect
Let’s consider a scenario: John regularly consumes both rice and pasta. Rice costs $5 per pound, while pasta costs $10. This means the relative price of one pound of pasta is two pounds of rice. At these prices, John buys one pound of pasta and two pounds of rice.
Now, imagine a technological advancement in rice farming reduces the price of rice to $2 per pound. The relative price of pasta has now risen to five pounds of rice. As a result, John, motivated by the price difference, substitutes more rice for pasta. This shift in consumption is solely due to the change in relative prices, not a change in John’s income.
Graphical Illustration of the Substitution Effect
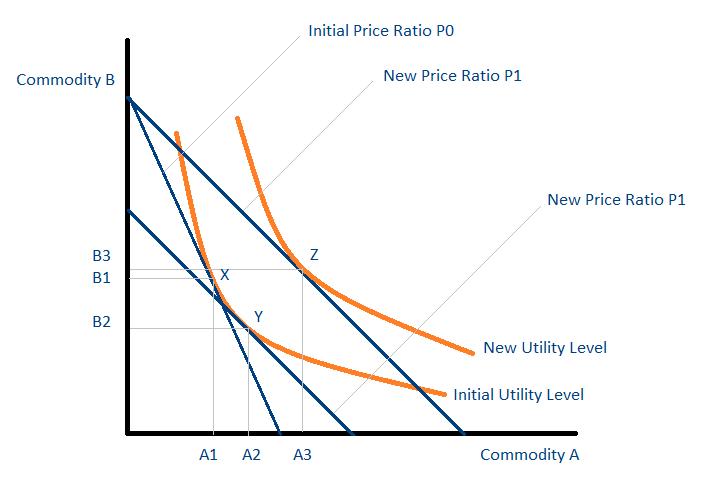
 Substitution Effect – Graphical IllustrationAlt: An indifference map illustrating the substitution effect, showing the shift in consumption from point X to Y due to a price change.
The graph above represents an indifference map. Each point along an orange curve (an indifference curve) provides the consumer with the same level of utility or satisfaction. The initial price ratio, P0, represents the relative price of good B compared to good A. The consumer starts at point X, consuming A1 units of A and B1 units of B.
📚 Unlock the World of AI and Humanity with These Two Free Books! 🚀
Dive into the thrilling realms of artificial intelligence and humanity with "The ECHO Conundrum" and "Awakening: Machines Dream of Being Human". These thought-provoking novels are
FREE this week! Don't miss the chance to explore stories that challenge the boundaries of technology and what it means to be human. Read More & Download
Suppose the price of good A falls from P0 to P1. Good B becomes relatively more expensive, while good A becomes relatively cheaper. The substitution effect measures the change in consumption while maintaining the consumer’s initial utility level. This is represented by the movement from point X to point Y along the same indifference curve. Consumption of A increases from A1 to A2, while consumption of B decreases from B1 to B2.
It’s important to note that Y isn’t the final consumption point. The consumer now has unspent income, which can be used to increase consumption further. The movement from Y to Z represents the income effect.
Slutsky Decomposition
The Slutsky Decomposition, or Slutsky Equation, is a crucial concept in microeconomics, developed by Eugene Slutsky. It dissects the change in demand for a good into two components: the substitution effect and the income effect.
Alt: The Slutsky Equation, demonstrating how a change in demand is decomposed into the substitution effect and the income effect.
The left side of the equation represents the total change in demand for good X due to a price change of good i. The first term on the right represents the substitution effect, mathematically the slope of the compensated (Hicksian) demand curve. The second term represents the income effect.
Conclusion
The substitution effect is a cornerstone of consumer theory, explaining how individuals react to price changes by adjusting their consumption patterns. By understanding this principle, businesses can better predict consumer behavior and make informed pricing decisions. Further exploration of related concepts like income effects, inferior goods, and the law of demand will enhance your comprehension of market dynamics.
📚 Unlock the World of AI and Humanity with These Two Free Books! 🚀
Dive into the thrilling realms of artificial intelligence and humanity with "The ECHO Conundrum" and "Awakening: Machines Dream of Being Human". These thought-provoking novels are FREE this week! Don't miss the chance to explore stories that challenge the boundaries of technology and what it means to be human.
Read More & Download

